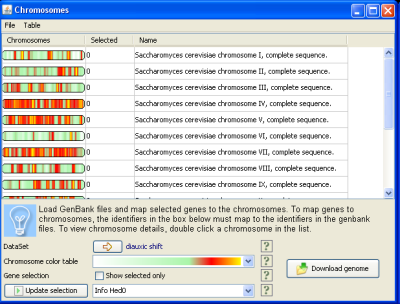
The Sequence mapping component enables you to examine a sequence and the genes it contains. The window to the right shows an overview of all the genes in a test dataset mapped to GenBank sequence files. The method uses the genetic elements in the genbank files which can automatically downloaded from J-Express or added manually. The colors on the sequence data shown (as chromosome icons) is a density representation where yellow and red areas are locations where many of the genes in the dataset can be found. The color table can be changed and new color tables can be added using the color table editor.
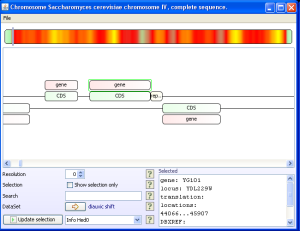
Analysis results from other components in J-Express can be mapped to this window to show where gene selections are located in the genome. The sequences can be further inspected as shown in the screenshot below.

A sequence detail window
See more in this presentation
