This license package contains the methods FSS and ANOVA
Feature subset selection will basically find the genes that best divide one group of genes and the rest, or two groups (multiple groups for ANOVA). To run this method, one or two sample groups must be defined.
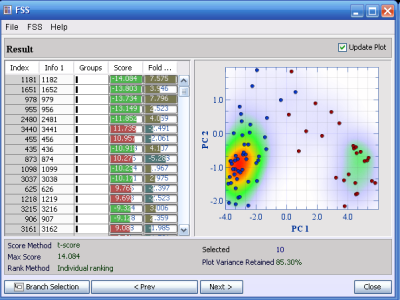
In this analysis window, you first select which method to use to discriminate between the classes (FSS or ANOVA). These methods produce very similar methods, but unlike ANOVA, FSS is based on statistical tests such as t-test which limit the classes to be separated to 2. For ANOVA, you can also select to display scores as p-values and out of these scores you can get a False Discovery Rate (FDR) for your selection. The caclulation of the FDR is based on the Benjamini/Hochberg methods and is therefore based on a subset of the list. Choosing the top 10 p-values in the list will automatically update the FDR for a list with the 10 top scoring p-values. The plot generated from selection will be the same for FSS and ANOVA (see example).
This analysis is a very quick and powerful method to select features (genes) that are differentially expressed between sample groups. For instance, if you have to sample groups, one treated and one untreated, you can use this method and select the top scoring genes. This selection can then be passed to other J-Express windows, such as the search and sort or line chart window for further exploration and verification.
