Gaussian kernels
The gaussian kernels method is a new framework for intuitive features selection and class prediction. It works by modelling a distribution-like weight vector from selected class labels. The method can be started by clicking the button on the main toolbar or selecting Gaussian Kernels from the Methods -> Supervised analysis menu. The first step is to define the flexibility of the kernels by selecting a standard deviation like parameter or width of the gauss curve which will be applied to each of the expression values for each sample class. Empirical studies has revealed two good estimates of this value, but a manual value can also be selected. One thing to keep in mind is that using a too high value will cause overfitting in the selection step, while to low values will normally lead to low flexibility and a class predictor with low value. A good solution is to try different values and see what is best fitting your data. Click Ok to go to the next step and view the layout off the feature vectors.

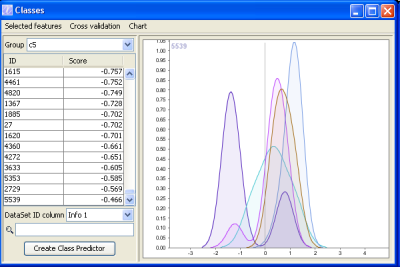
In the example to the right, a dataset with 5 classes has been selected and the genes has been scored. The list to the left shows all the genes in the dataset and in this case class 5, wich is the purple curve in the chart has been selected. The list to the left shows all genes sorted from low score at the top to highest score at the bottom. Each score represent the ammount of area under the purple curve not intersected by other curves. As you can see from the chart, the chosen gene has most of its expression values in the same area. Only overlapped slightly by the red and green group. Thus it looks like a good feature for separating samples from group c5 from the rest of the groups.
One of the important features of the Gaussian kernels is that feature sets can be used to create class predictors for new data sets where class memberships are unknown. Class predictors contains a selected number of features selected from a training dataset and can be stored in files for later use.
Class predictors
Class predictors are created from the Gaussian kernels method and consist of a number of features and a known class label. The number of features for each class predictor can be different for each class and the predictor is created by selecting a number of rows in the gaussian kernels result list. You can use these class predictors to predict class membership for samples from other datasets.

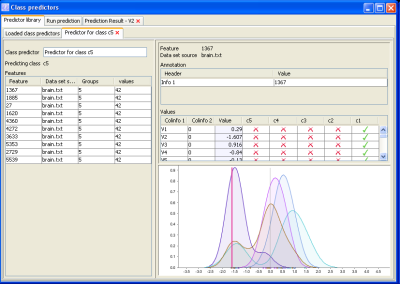
The main class predictor window contains all the class predictors created from the Gaussian kernels method, and this list may be saved and loaded. It shows the predictor name (which was chosen when the predictor was created), name of the class it predicts (automatically assigned), number of features it contains and a magnifier cell you can click to view the class predictor details. Besides the feature names, class predictor name etc., the details window contains a values panel. In this panel, you can see all the sample annotation, expression value and which groups the feature was a member of (green Vs). Clicking a row in the values panel will show the sample value as a pink line in the class predictor chart (the colored curves). Each curve has a color equal to the group it predicts.

A Prediction result example
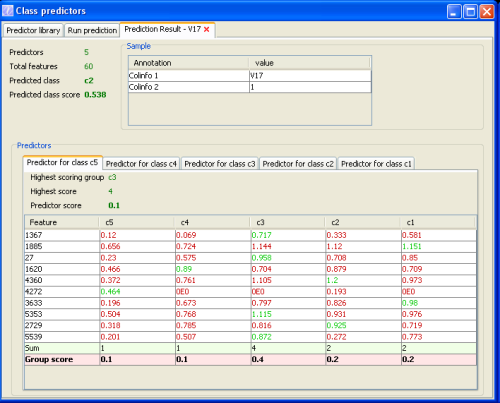
The prediction result example above can be read in the following way:
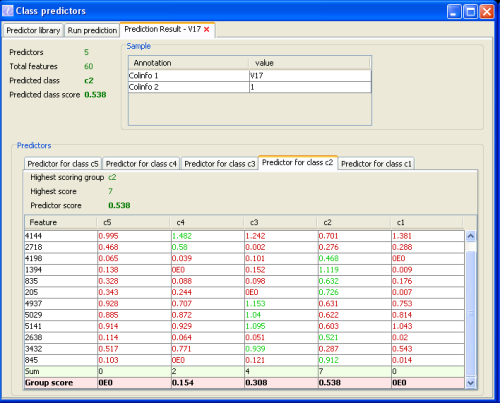
The sample panel contains information about the sample we tried to predict class membership for. If you chose to predict multiple samples, each of them will get their own panel such as the one above. This sample (v17) was correctly classified as class c2. You can see how the predictor run came to this result by looking at the results from all used class predictors (class c1 -c5). A class predictor that did not win the election is shown in the window above (predictor c5). In this predictor, the most voting class was class c3 with 4 votes (the green numbers). These numbers represent the height of the curve for the value of the sample for each feature (rows). The picture below shows how the class predictor for the correct class c2 performed:

In this class predictor, 7 of the 12 features voted for class c2 which was the highest number of votes for all class predictors. The final voting value is 7/12=0.538 which is the highest overall vote value and the result of the prediction run.This result can also be found in the top left panel of the result window.
