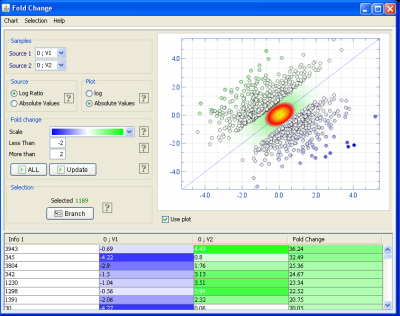
The fold change viewer can be used to see changes between two samples (columns in J-Express) or between sample groups (by using the sample groups mean viewer).
Together with the other tools in J-Express this can be a simple, intuitive and powerful method to quickly determine the genes differentially expressed between two samples. Scientists often use this as a screening method to quickly pull out a subset of the data to perform more extensive and time consuming analysis on.
The example screenshot shows the Fold change viewer in action. The plot shows the two selected samples where more negative fold changes have a solid blue color and higher positive fold changes have a solid green color. The fold change list can be sorted and selections can be passed to other J-Express components such as the annotation viewer or the line chart window.
