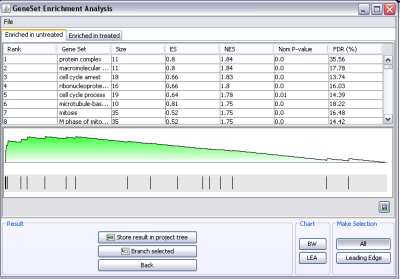
Gene set analysis is used to look for sets of related genes that follow the same trends in the dataset. It can be performed on either categorical or continuous data. Categorical data is of the type before vs after infection, while continuous data can be time series data.

Categorical
The traditional way of analyzing data for differentially expressed genes has been to use statistics that look at each gene by itself. There are several advantages to analyze sets of genes rather than individual genes.
If the genes only change moderately it may be difficult to find significant change by looking at each gene separately. If, on the other hand, many genes belonging to the same gene set, e.g. immunity and defense, are changed, even moderately, this could be an interesting finding, and the a priori defined relationship between these genes gives more statistical power to detect such smaller changes (affecting a whole set of related genes) compared to a per gene statistic.
It has been common to do simple overrepresentation analysis of for instance GO terms among genes found differentially expressed compared to the non-differentially expressed genes. One would then calculate a per gene statistic, rank the genes and select a cutoff on a certain number of genes or a certain p-value to divide the genes into differentially expressed and non-differentially expressed genes. The per gene individual statistic, and thus the gene expression values themselves, is only used to rank the genes in this approach, not to evaluate the gene sets themselves.
In contrast the gene set enrichment method does not depend on a cutoff, and use the gene expression values of the genes in the evaluation of a gene set. After ranking the genes according to some per gene statistic, the entire ranked list is used to assess how the genes of a gene set distribute across the ranked list. The score (statistic) of individual genes are taken into account when evaluating a set of genes for differential expression.
Imposing a hard cut off on a list of genes with smoothly decreasing statistical scores is bound to be an arbitrary choice, and introduces an artificial border that is oversimplifying the biology. Genes in the area below the cutoff is easily missed that could exhibit the same behavior as related genes in the list above the cutoff.
Continuous
Normally we cluster continuous data to search for genes that have similar expression profiles, and then we go through the genes belonging to a cluster to see if they share some common characteristics. The problem with this approach is that the decision on which cluster a gene is a member of may to some extent be arbitrary, depending on the clustering method, the number of predefined clusters and the initialization of the clusters. Some genes that belong to the same gene set may therefor sometimes end up in the same cluster, while other times they end up in different clusters.
Another way continuous data have been analyzed has been to search for genes in the data set with a certain degree of similarity to a particular search profile. Obviously this creates a similar problem as the one described for categorical data; where do we set the cut off? How similar do a profile has to be to make it on to our gene list? All sorts of profiles exist in a data set and it is most likely going to be very difficult to set a clear cut threshold to say that a particular set of genes are similar to the selected profile, while the others are not similar. The resulting limit is therefore always going to be random.
By using a gene search profile and predefined gene sets it is possible to avoid the problems of clustering and setting a cutoff for similarity to a gene profile. We can also get a significance score for each gene set. All the genes in the data set will then be ranked according to correlation with the search profile. Once the genes have been ranked, the gene sets are scored exactly like they are for categorical data.
