Self-Organising Maps
Self-organising maps is an unsupervised clustering method. You control the number of clusters you get out of this analysis by changing the Net Height and Net Width.
- Click the
 ( Self-Organizing Map ) button or select Methods | Self-Organizing Map from the J-Express menu bar.
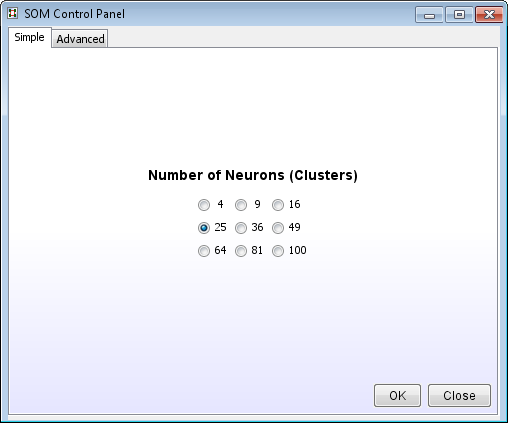
- For most cases the Simple tab (using the default settings) will work just fine. Select the number of final clusters and click Ok
This method is a lot faster than the k-means clustering and the clusters are ordered. See how neighbouring clusters are similar.
- The five right most buttons on the button panel allows you to toggle between different views of the cluster charts
- Clicking on a cluster will open a Gene Graph showing the genes belonging to this cluster. See here for more on how to create groups, branch off some genes from the Gene Graph Viewer, or just general use of it.
- The Thumbnails menu has options for getting more information about the clusters, such as:
- Cluster size
- Show group colours (This is useful if you have coloured some genes of interest). To
control the different group colours, select the
 ( Group Controller ) from
the J-Express main button bar. Change the colours by clicking on the colour rectangles
and then click Update all components.
( Group Controller ) from
the J-Express main button bar. Change the colours by clicking on the colour rectangles
and then click Update all components.
- In the Groups window: uncheck the group called All and press Update all Components. Look at the k-means clustering window. You will see that
only genes that are members of active groups will be painted.
- Turn on All Indices again and click the Update all Components button.
- Put in Tree allows you to save this analysis in the project tree.
Advanced
- Click the Advanced tab in the SOM Control Panel
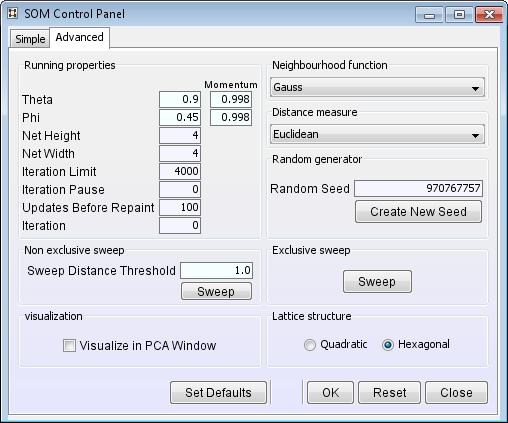
- Select Visualize in PCA Window. Visualising
the SOM progress in a PCA window lets you better choose the correct learning
parameters: Theta, Phi and Momentum. Most of the time the default values will work perfectly.
- Choose a neighbourhood function and a distance measure
- Click OK
- Move the two windows (SOM and SOM Control Panel) so you can see both.
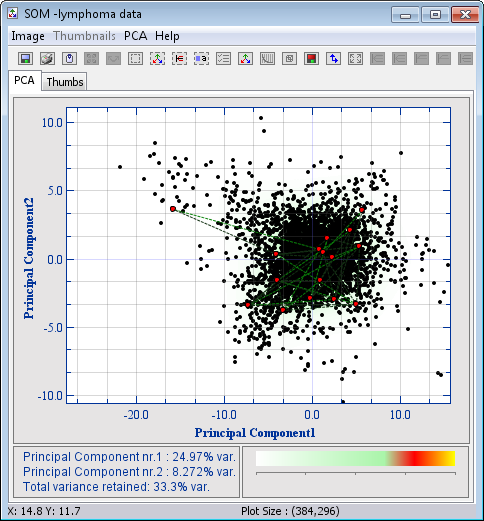
The red neurons are now placed randomly in the data space
- When you click the run button in the SOM control panel, the learning will start. This algorithm runs very fast. If you want to see what happens in each iteration, you can increase the time the algorithm should pause between each iteration at Iteration Pause. Updates before Repaint sets the number of iterations that should be performed before the graphical view of the SOM is updated. If you need to run again, click Stop, and Reset.
- See how the neurons are ordered in a hexagonal lattice structure and at the same time dragged towards dense areas. (Note that the neurons of the SOM are only projected into the PCA plane and are not linked in any other way)
- Run the SOM until the Theta and Phi are 0, then click Stop
- Click SWEEP in the Exclusive Sweep panel in the SOM control panel. Exclusive
sweep means that each profile can only be in one cluster, the nearest one.
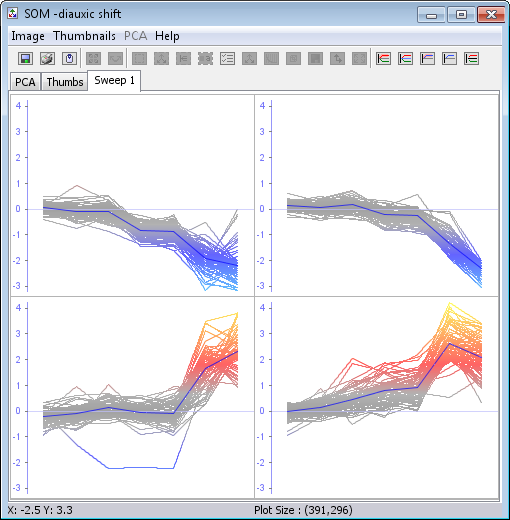
- In the SOM window, click the Sweep 1 tab
- This shows the clusters that each gene has been grouped into, and is what would be shown as the result if the you had chosen the Simple tab in the SOM Control Panel
- The five right most buttons on the button panel allows you to toggle between different views of the cluster charts
- Clicking on a cluster will open a Gene Graph showing the genes belonging to this cluster. See here for more on how to create groups, branch off some genes from the Gene Graph Viewer, or just general use of it.
- The Thumbnails menu has options for getting more information about the clusters, such as:
- Cluster size
- Show group colours (This is useful if you have coloured some genes of interest). To
control the different group colours, select the ( Group Controller ) from
the J-Express main button bar. Change the colours by clicking on the colour rectangles
and then click Update all components.
- In the Groups window: uncheck the group called All and press Update all Components. Look at the k-means clustering window. You will see that
only genes that are members of active groups will be painted.
- Turn on All Indices again and click the Update all Components button.
- Put in Tree allows you to save this analysis in the project tree.