- Create groups of the samples you want to compare first.
- Then open a new FSS window and select the groups you want to compare.
Feature Subset Selection (FSS) is a method that can be used to find a subset of genes (features) that either alone, or in pairs are able to discriminate between groups of samples. To score genes based on how they separate between groups on their own, the ranking method should be set to Individual ranking. This is equivalent to doing traditional e.g. T-test (if t-score is selected as the scoring function). It is also possible to score genes based on how they discriminate between groups when paired with another gene. There are two ranking methods available for doing this analysis: Greedy pairs ranking and All pairs ranking.
A number of different statistical tests are available for scoring the genes.
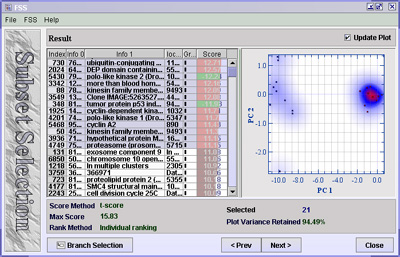
If you select one gene from the table, the data matrix values for this gene will be plotted against itself. Look at the spots along the diagonal and see if spots with the same colours are clearly separated. If selecting one gene does not separate the groups well you can try selecting two genes. The values of one gene will now be plotted against the other. This will spread the data out into two dimensions and hopefully give you a better separation. You can continue selecting more genes to see if you get a good separation of the data. When selecting more than two genes the first and second principal components are used as axis to plot the spots. Note: there is no point in plotting too many genes. Since it takes a long time to calculate principal components for many genes, it is advised to uncheck Update Plot for large selections. For more help on this component press F1 for help.