1. Click the ![]() button
button
2. Click the Normalization button.
3. Click the Global Lowess button.
4. Set the Plot Type to log
5. Click plot
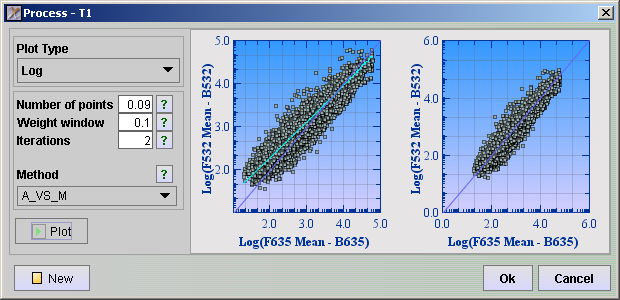
The left window is the un-normalized data, the blue line is the normalization line and the left window is the normalized data
5. Click OK
Quantile normalisation (Bolstad et al 2002) makes different arrays comparable by making sure that the distribution of intensities are the same across arrays. The normalisation distribution is chosen by averaging each quantile across chips.