Show all profiles (
![]() ):
):
To show all the profiles contained
in the clusters, click the ![]() button
(Show all profiles) on the K-Means window tool bar, or select Thumbnails|Show
All Profiles from the K-Means window menu bar. To go back to showing the
mean profiles click the
button
(Show all profiles) on the K-Means window tool bar, or select Thumbnails|Show
All Profiles from the K-Means window menu bar. To go back to showing the
mean profiles click the ![]() button
(Show Mean Only) on the K-Means window tool bar, or select Thumbnails|Show
Mean Profile Only from the K-Means window menu bar.
button
(Show Mean Only) on the K-Means window tool bar, or select Thumbnails|Show
Mean Profile Only from the K-Means window menu bar.
Saving an image of the thumbnails
( ![]() ):
):
To save an image of the thumbnails, click the ![]() button on the K-Means window tool bar or select select Image | Save
from the K-means menu bar. Locate the folder where you want to save the image
by clicking the browse button, set the appropriate file extension,
and enter a filename. Click OK.
button on the K-Means window tool bar or select select Image | Save
from the K-means menu bar. Locate the folder where you want to save the image
by clicking the browse button, set the appropriate file extension,
and enter a filename. Click OK.
Printing the thumbnails (
![]() ):
):
To print the thumbnails click the ![]() button on the K-Means window tool bar.
button on the K-Means window tool bar.
Export to HTML (
![]() ):
):
To generate a HTML version of the thumbnails,
click the ![]() button
(Export To HTML) on the K-Means window tool bar, or select Thumbnails|Export
to HTML on the K-Means window menu bar. Select a location and a name for
the html file (remember to include the .html extension) in the dialog that appears. A subdirectory
containing images for the web page will be created along with a HTML file that
shows thumbnails of the clusters, and lists the contents of each cluster.
button
(Export To HTML) on the K-Means window tool bar, or select Thumbnails|Export
to HTML on the K-Means window menu bar. Select a location and a name for
the html file (remember to include the .html extension) in the dialog that appears. A subdirectory
containing images for the web page will be created along with a HTML file that
shows thumbnails of the clusters, and lists the contents of each cluster.
Antialiasing (
![]() ):
):
To improve the visual quality of the
thumbnails click the ![]() button
(Antialiasing) on the K-Means window tool bar, or select Line Chart|Toggle
Antialias from the K-Means window menu bar. The aliased (jagged) edges on
the graphs and text will disappear.
button
(Antialiasing) on the K-Means window tool bar, or select Line Chart|Toggle
Antialias from the K-Means window menu bar. The aliased (jagged) edges on
the graphs and text will disappear.
Note: on large datasets this function can be time-consuming. If you experience long pauses while refreshing or generating displays we suggest turning Antialiasing off.
Toggle Colors (
![]() ):
):
To use group colors in the graphs,
click the ![]() button
(Toggle Colors) on the K-Means window toolbar or select Thumbnails|Toggle
Group Colors
from the K-Means window menu bar.
button
(Toggle Colors) on the K-Means window toolbar or select Thumbnails|Toggle
Group Colors
from the K-Means window menu bar.
Put in Tree
To place the entire component into the project tree click the ![]() button, Thumbnails|Put in Tree from the K-means window menu bar.
This creates a new node with the symbol
button, Thumbnails|Put in Tree from the K-means window menu bar.
This creates a new node with the symbol ![]() in the project tree that acts as a direct shortcut to the current component.
in the project tree that acts as a direct shortcut to the current component.
Show Variance Diagram (
![]() ):
):
Select Thumbnails|Show Variance Diagram from the K-Means menu bar to open the Variance window. This window shows a square grid of cells, where each cell represents a cluster. The cells are color-coded to show the amount of variance in each cluster according to the color key table on the left side of the window. Hovering the mouse cursor over a cell displays a tool tip with the exact Single Variance, Between Variance and Cluster Size values of the cluster represented by the cell. If the box Clustersize as alpha is checked, the number of profiles in a cluster will indicated by the transparency of a cell against a grey grid background. A highly transparent cell contains few profiles, whereas an almost opaque cell contains many profiles. Click on a cell to highlight the corresponding thumbnail in the K-Means window. Click the Close button to close the variance window.
Use Scrollbars (
![]() ):
):
By default, the thumbnails are not scaled to fit the K-means window. If all
thumbnails do not fit in the K-means window, scrollbars will appear to enable
you to examine all thumbnails. If thumbnails have been scaled to fit the window,
you can go back to using the scroll bars by clicking the ![]() button
(Use scrollbars) or select Thumbnails | Horisontal Scroll from
the K-means window menu bar. Set the thumb width by dragging the grey column-header.
button
(Use scrollbars) or select Thumbnails | Horisontal Scroll from
the K-means window menu bar. Set the thumb width by dragging the grey column-header.
Fit in Window ( ![]() ):
):
To scale the thumbnails according to the window size, click the ![]() button (Fit in window) or select Thumbnails | Horisontal Fit from
the K-means window menu bar.
button (Fit in window) or select Thumbnails | Horisontal Fit from
the K-means window menu bar.
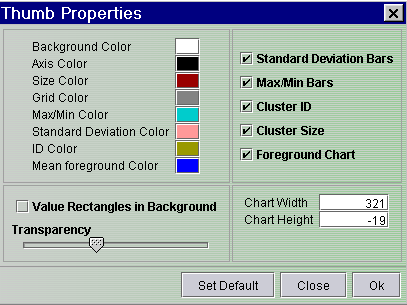
Visual Properties
Right click on a thumbnail to set the visual properties for the K-means thumbnails,
or select Thumbnails | ![]() Thumbnail Layout from the K-means window menu bar. The options are:
Thumbnail Layout from the K-means window menu bar. The options are:
Chart Width/Height - sets the width/height of the chart in pixels.
Color options - click any of the colored boxes to set the desired color for that option.
Paint Standard Deviation bars - check this box to include the bars indicating the standard deviation for each state.
Paint Max/Min bars - check this box to include the bars that indicate the maximum and minimum values for each state.
Include Cluster ID - check this box to display the cluster ID of a cluster on its thumbnail.
Include Cluster Size - check this box to display the amount of profiles in a cluster on its thumbnail.
Foreground Chart - check this box to display mean or all profiles in the thumbnail windows
Value Rectangles in Background - if checked, it will display the values of the profiles in this cluster as colored rectangles, one row for each profile.
Transparency - the slide bar only has an effect if the Value Rectangles in Background is checked. The slide decides the transparency of the foreground chart. Slide bar to the very left - 100% transparency - the value rectangles in the background shows strongly. Slide bar t the very right - 0% transparency - the value rectangles in the background cannot be seen.
Focusing on single clusters:
To focus on a single cluster simply click on its thumbnail. A new tab appears labeled with the ID number of that cluster. Clicking on the new tab brings up a Gene Graph viewer showing all the profiles contained in that cluster.
Branch dataset (
![]() ):
):
One additional feature that exists
for the zoomed selection in the K-Means window is to branch the dataset into
a new node in the Project Tree. To do this, select the tab that contains the
data you want to branch. Then click the ![]() button
on the K-Means window tool bar, or select Line Chart|Branch Data Set
from the K-Means window menu bar. A new node will be added below the current
one in the Project Tree labeled with the K-Means symbol
button
on the K-Means window tool bar, or select Line Chart|Branch Data Set
from the K-Means window menu bar. A new node will be added below the current
one in the Project Tree labeled with the K-Means symbol ![]() .
.
Remove tabs ( ![]() ):
):
To remove a tab from the K-Means window
select the tab to be removed. Then click the ![]() button
(Delete Active Tab) on the K-Means window tool bar, or select Line
Chart|Delete Active Tab from the K-Means window menu bar.
button
(Delete Active Tab) on the K-Means window tool bar, or select Line
Chart|Delete Active Tab from the K-Means window menu bar.
Put in Tree
To place the entire component into the project tree select Thumbnails|Put in Tree from the thumbnails menu bar. This creates a new node in the project tree that acts as a direct shortcut to the current component.Open External Link
( ![]() ):
):
Shadow Unselected
( ![]() ):
):
Create Group(s) ( ![]() ) :
) :
The Create Group(s) ( ![]() ) button will create a group that can be managed further by the Group
Controller (
) button will create a group that can be managed further by the Group
Controller ( ![]() ) on the J-Express Pro main tool bar.
) on the J-Express Pro main tool bar.
Zoom/Frame Area (
![]() ):
):
Move ( ![]() ):
):
The move( ![]() ) button enables you to grab the graph window using the mouse cursor instead
of using the scrollbars (if the graph is to big to fit in the window).
) button enables you to grab the graph window using the mouse cursor instead
of using the scrollbars (if the graph is to big to fit in the window).
Repaint ( ![]() ):
):
If changes you make do not take effect immediately, press
the ![]() button
(Update and Repaint).
button
(Update and Repaint).
Copy image to Clipboard ( ![]() );
);
To copy the image in any of the tabs to clipboard, click the
![]() button.
button.