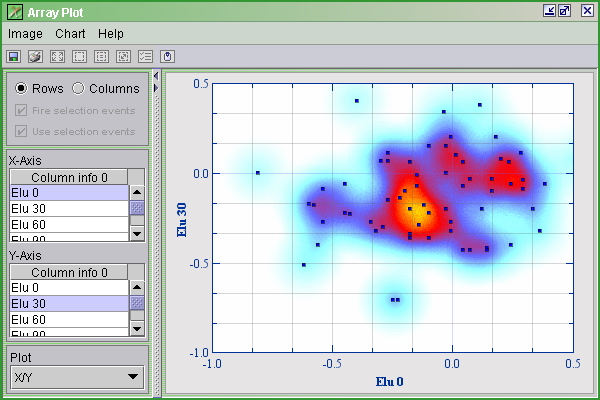
Array plot using density area.
The array plot allows you to create graphs of each profile in relation to another, or of each column (state) in relation to another. The array plot window has two areas on the left side used to select the profiles or states to be used as x- and y-axis. Use the Rows/Columns selector above these to choose between plotting columns vs. columns, or rows vs. rows.
Save Image ( ![]() ):
):
To save an image of the plot, press the Save Image (
![]() ) button or select the Image|Save from the Array Plot window menu
bar. Select the location, name of the file and file
format. Click Ok.
) button or select the Image|Save from the Array Plot window menu
bar. Select the location, name of the file and file
format. Click Ok.
Print Image (  ):
):
To print the plot press Print Image (
) button or select Image|Print button from the Array Plot window
menu bar.
To zoom in on an area of interest press Zoom In ( ![]() ) button, then click and drag out a selection box on the plot. To
zoom back out again press Zoom out (
) button, then click and drag out a selection box on the plot. To
zoom back out again press Zoom out ( ![]() ) button or select Chart|Zoom out.
) button or select Chart|Zoom out.
Shadow Unselected ( ![]() ):
):
Shadow Unselected ( ![]() ) is only useful when the Rows radio button is selected. The selected
profiles will be shown in full color, while the other profiles will fade to
grey color.
) is only useful when the Rows radio button is selected. The selected
profiles will be shown in full color, while the other profiles will fade to
grey color.
Create Selection ( ![]() ):
):
Create Selection ( ![]() ) is only useful when the Rows radiobutton is selected. To create a selection
press the Create Selection (
) is only useful when the Rows radiobutton is selected. To create a selection
press the Create Selection ( ![]() ) button. There are two different Frame Methods to use;
) button. There are two different Frame Methods to use; ![]() Square and
Square and ![]() Lasso. When using the
Lasso. When using the ![]() Square method, click and drag the mouse around the area you wish to select.
The
Square method, click and drag the mouse around the area you wish to select.
The ![]() Lasso method lets you draw a line around the points you want to select.
It is also possible to color the selection area with a color from the list in
the Frame Method pull-down menu.
Lasso method lets you draw a line around the points you want to select.
It is also possible to color the selection area with a color from the list in
the Frame Method pull-down menu.
It is also possible to select genes from a Gene
Graph window. Open a Gene Graph ( ![]() ) from the J-Express Pro tool bar, and select genes from the list. If the Shadow
Unselected (
) from the J-Express Pro tool bar, and select genes from the list. If the Shadow
Unselected ( ![]() ) has been selected in the Array Plot, the genes selected in the Gene Graph
will now be shown in full color in the Array Plot.
) has been selected in the Array Plot, the genes selected in the Gene Graph
will now be shown in full color in the Array Plot.
Copy Clip Image to Clipboard ( ![]() ):
):
To copy the image in any of the tabs to clipboard, click the ![]() button.
button.
Fire Selection Event - check to update the chosen rows when selecting points in the graph.
Use Selection Event - check to update selected rows when they are selected from another component, such as Gene Graph.
Customizing the Array
Plot ( ![]() )
)
Select Chart | ![]() Chart Settings from the Array Plot menu bar. Another way to bring
up the Chart properties window is by right clicking on
the Array plot.
Chart Settings from the Array Plot menu bar. Another way to bring
up the Chart properties window is by right clicking on
the Array plot.